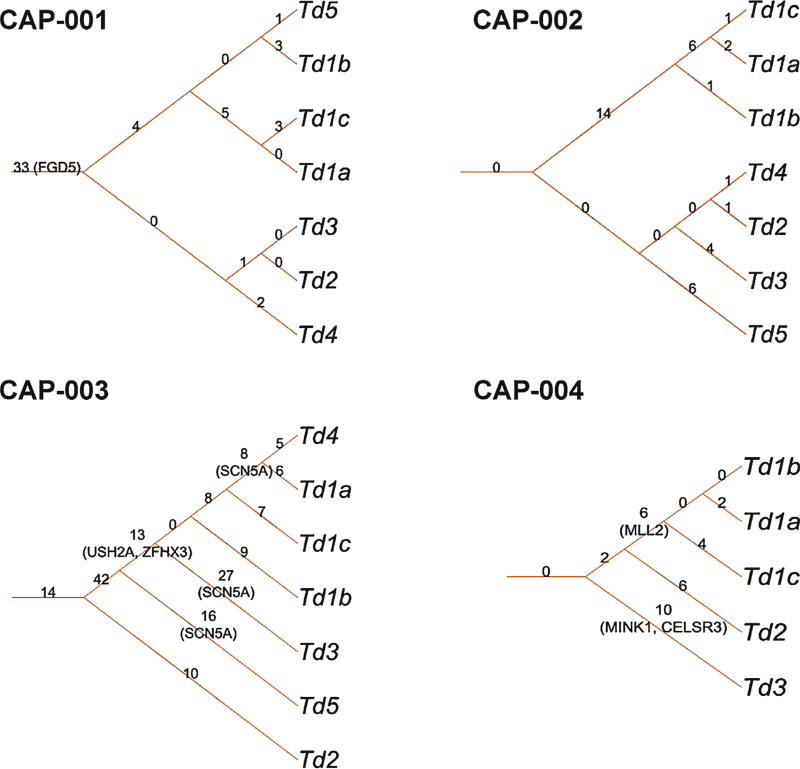
Fig. 2.
Prostate cancer (CaP) genomic heterogeneity evidenced in phylogenetic trees based on somatic mutations. For each patient, a phylogenetic tree was generated according to the somatic mutation status of his CaP foci. The root edge label shows the number of mutations shared by all intraprostatic CaP foci. The internal edge label shows the number of mutations shared only by foci of the subtree. The leaf edge shows the number of private mutations present only in the leaf focus. The genes shown in parentheses (FGD5, SCN5A, USH2A, ZFHX3, MLL2, MINK1, CELSR3) are associated with putative driver somatic mutations (Supplementary Table 4).

