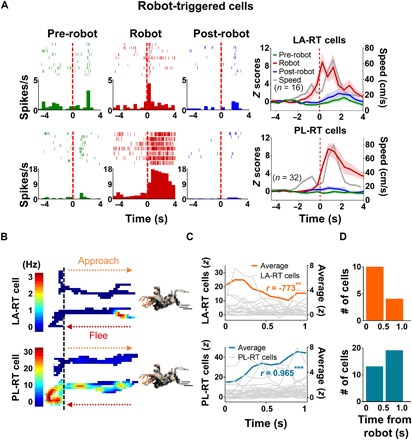
Fig. 4. RT cells in LA and PL.

(A) Categorized robot cells that exhibited their maximal firing after the robot was activated (RT cells) in both LA (top) and PL (bottom). The first three columns show the representative LA-RT and PL-RT cells in each phase. The last column shows the population activity of RT cells in LA and PL and the movement speeds of rats (shown in gray) around the robot activation time (t = 0). (B) Examples of firing rate maps of LA-RT and PL-RT cells during the pre-surge (−4 to 0 s before the robot activation; approach) and surge (0 to 4 s subsequent to robot activation; flee) epochs. The color scale for the firing rate corresponds to the firing rate (red, highest; blue, no spike) for the unit. Dashed vertical lines demarcate the nest–foraging area boundary. (C) During the robot surge period (1 s), averaged LA-RT and PL-RT activity (0.1-s bin) linearly decreased and increased subsequent to robot activation, respectively. (D) During the robot surge period, LA-RT cells showed maximal firing during the initial 0.5-s bin, whereas PL-RT cells showed maximal firing during the second bin (χ2 test, P < 0.01).
