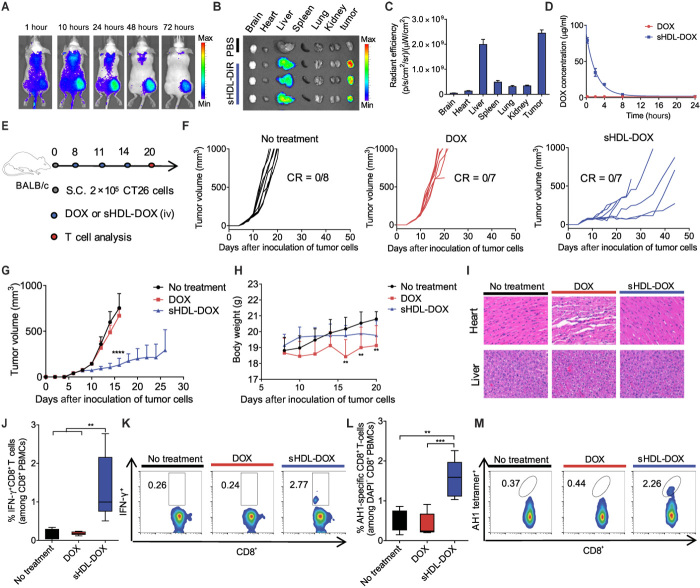
Fig. 3. Antitumor efficacy and T cell immunity exerted by sHDL-DOX monotherapy.
(A) CT26 tumor–bearing mice were intravenously (iv) injected with sHDL-DiR, and the biodistribution of sHDL-DiR at different time points was imaged by the IVIS optical imaging system. (B) At 72 hours after injection, major organs were harvested and imaged ex vivo, and (C) fluorescence signal was quantified. (D) BALB/c mice were intravenously injected with free DOX or sHDL-DOX at DOX (4 mg/kg). Shown are the serum concentrations of DOX fitted to the two-compartment model. Data represent mean ± SD (n = 3) from a representative experiment from two to three independent experiments. (E) BALB/c mice were subcutaneously inoculated with 2 × 10⁵ CT26 cells on day 0. On days 8, 11, and 14, tumor-bearing mice were treated with indicated formulations at DOX (4 mg/kg). (F and G) The average and individual CT26 tumor growth curves for mice treated with indicated formulations. CR, complete tumor regression. (H) Body weights of CT26 tumor–bearing mice treated with indicated formulations. (I) Hematoxylin and eosin (H&E) staining of the hearts and livers harvested on day 20 from tumor-bearing mice treated with indicated formulations. (J and K) The percentage of tumor cell-reactive T cells (IFN-γ+CD8+) among PBMCs on day 20 was measured by ICS. Shown are (J) the percentage of IFN-γ+CD8+ among PBMCs on day 20, and (K) the representative scatterplots. (L) The percentage of CT26 tumor antigen peptide AH1-specific CD8+ T cells among PBMC on day 20, and (M) the representative scatterplots. Data in (J) and (L) are represented as box plots (whiskers, 5th to 95th percentile; n = 5) from a representative experiment from two independent experiments. **P < 0.01, ***P < 0.001, and ****P < 0.0001 analyzed by one-way ANOVA (J and L) or two-way ANOVA (G and H) with Tukey’s multiple comparisons post test.

