
Fig. 4. Potentiation of αPD-1 immunotherapy with sHDL-DOX for treatment of CT26 tumors.
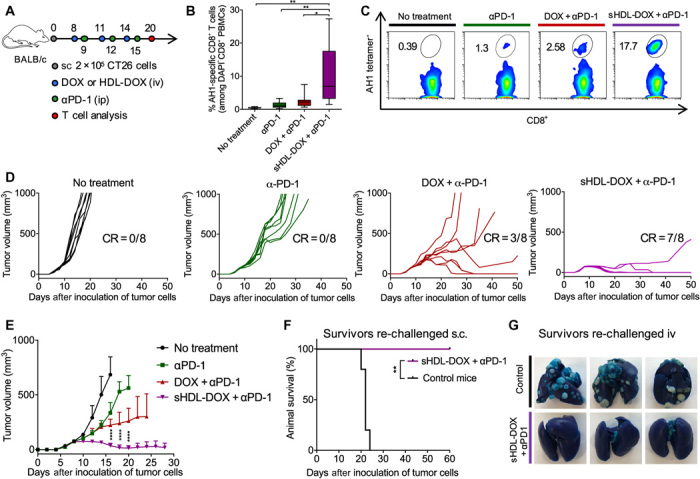
(A) BALB/c mice were subcutaneously (sc) inoculated with 2 × 10⁵ CT26 cells on day 0. On days 8, 11, and 14, tumor-bearing mice were treated with indicated formulations at DOX (4 mg/kg). αPD-1 was injected intraperitoneally (ip) at 100 μg per dose on days 9, 12, and 15. (B) The percentage of CT26 tumor antigen AH1-specific CD8+ T cells among PBMCs on day 20, and (C) the representative scatterplots. Data are represented as box plots (whiskers, 5th to 95th percentile). n = 5 from a representative experiment from two independent experiments. (D) Individual growth curves for mice treated with indicated formulations. (E) The average tumor growth curves for mice treated with indicated formulations. Data represent mean ± SD (n = 8) from a representative experiment from two independent experiments. (F and G) On day 60, sHDL-DOX + αPD-1–treated animals in (E) were re-challenged by subcutaneous or intravenous injection of 2 × 10⁵ CT26 cells. For the control groups, naïve BALB/c mice were re-challenged with the same number of CT26 cells. Shown are the animal survival (F) and lung metastasis (G) of CT26 cells on day 22 after re-challenge. Naïve mice were used as control and inoculated with the same number of tumor cells. *P < 0.05, **P < 0.01, and ****P < 0.0001 analyzed by one-way ANOVA (B) or two-way ANOVA (E) with Tukey’s multiple comparisons post test or log rank (Mantel-Cox) test (F).