
Fig. 3. Genome-wide differential histone modifications in various brain cell populations.
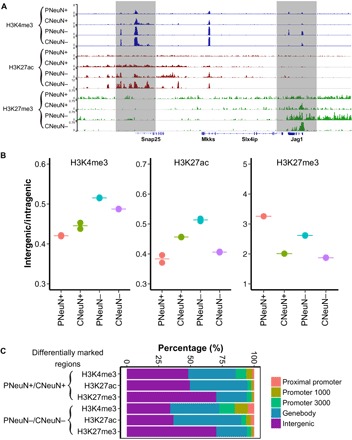
The data under analysis were generated with 1000 nuclei per assay using samples from mouse M3. (A) SurfaceChIP-seq signals around Snap25 gene for all four cell populations. (B) H3K4me3, H3K27ac, and H3K27me3 coverage in intergenic regions relative to intragenic regions (genebody). The pair-wise comparisons of H3K4me3, H3K27ac, and H3K27me3 for four cell populations show significant difference (P < 0.01), except PNeuN+/CNeuN+ and CNeuN+/CNeuN− on H3K4me3 mark and PNeuN+/CNeuN+ on H3K27ac mark. (C) Distributions of differentially marked regions in various genomic features.