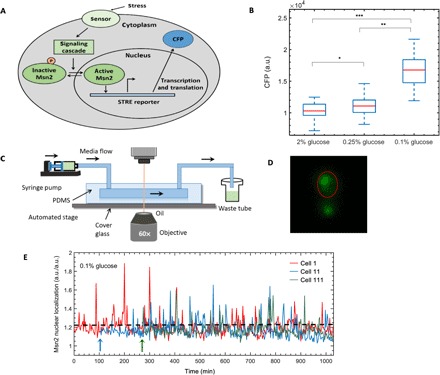
Fig. 1. Strain background, choice of glucose limitation stress, experimental setup, and single-cell Msn2 localization trajectories.

(A) Pictorial representation of Msn2 translocation and activation of a synthetic promoter driving CFP in response to stress. (B) Glucose stress concentrations to be applied in lineage experiments. CFP expression of cells from three different glucose concentrations was collected from microscopy experiments, and the boxplots show distribution of CFP from single cells for each glucose concentration. For each boxplot, red line denotes median or 50th percentile; bottom of the blue box denotes the lower quartile or 25th percentile; top of the blue box denotes the upper quartile or 75th percentile of the distribution. *, significant difference (P = 0.03) in CFP expression between 2% glucose and 0.25% glucose; **, significant difference (P = 1.6 × 10⁻¹⁴) in CFP expression between 0.25% glucose and 0.1% glucose; ***, significant difference (P = 9.3 × 10⁻¹⁷) in CFP expression between 2% glucose and 0.1% glucose. Numbers of cells used for analysis in 2, 0.25, and 0.1% glucose concentrations are 36, 28, and 30, respectively. (C) Schematic showing a typical experimental setup of a time-lapse movie. (D) Snapshot from a time-lapse movie of cells showing Msn2 nuclear localization in 0.1% glucose. Nuclear localization of Msn2 has been quantified by an image analysis algorithm, without using a nuclear marker (Supplementary Materials). (E) Msn2 nuclear localization trajectories of three representative cells in 0.1% glucose. Msn2 nuclear localization is a ratio of two quantities (mean Msn2 nuclear localization in nucleus and mean Msn2 localization in whole cell), each having arbitrary unit (a.u.). Hence, the single-cell Msn2 nuclear localization values in our study are unitless. Cell 11 and cell 111 are the daughter and granddaughter cells, respectively, of cell 1. Arrows denote the time of birth of a new cell. Dashed horizontal lines denote the threshold used to quantify nuclear localization burst of Msn2.
