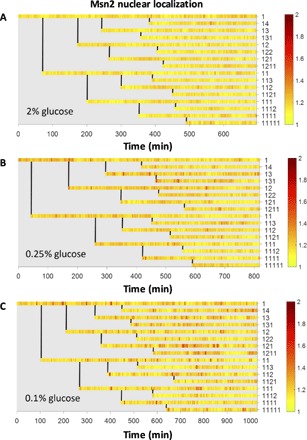
Fig. 2. Msn2 localization in single cells collected in a lineage-dependent manner in different glucose concentrations.

(A to C) Lineage maps of Msn2 localization from one experiment each in (A) 2% glucose, (B) 0.25% glucose, and (C) 0.1% glucose. Each row represents Msn2 localization of a single cell. Genealogical position of that cell in the family tree is labeled to the right of a row. Vertical lines denote the time at which a mother cell divides to form a daughter cell. Color bar shows the intensity of Msn2 localization signal.
