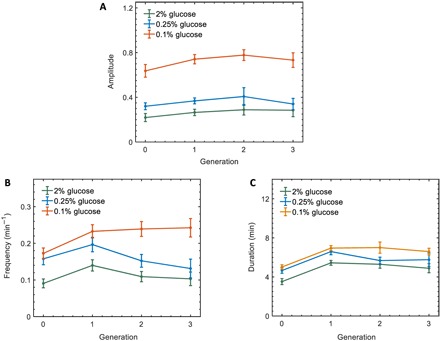
Fig. 4. Msn2 burst dynamics as a function of cell generation.

(A to C) Msn2 burst amplitude (A), frequency (B), and duration (C) as a function of cell generations in different glucose concentrations. Error bars represent SEM. One cell generation is defined as the time interval between the onset of two consecutive buds of a cell. Generation 0 refers to the time interval between the birth of a cell to the emergence of its first bud. Table S5 lists the P values resulting from comparing amplitude, frequency, and duration between 2 and 0.25% glucose concentrations as well as between 2 and 0.1% glucose concentrations across different cell generations.
