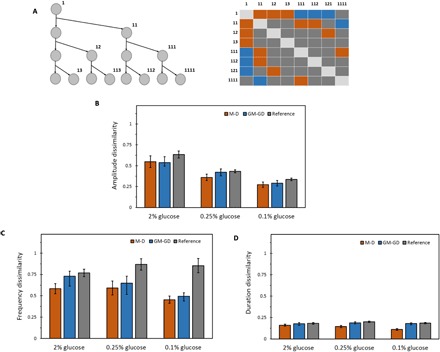
Fig. 6. Heritability of localization features of Msn2.

(A) Left: Example of a lineage tree to the third generation. Three generations down, starting from the ancestor cell, give rise to eight cells in different genealogical positions of the tree. Right: All the M-D cell pairs (orange boxes), GM-GD cell pairs (blue boxes), and reference cell pairs (gray boxes) that can be obtained from the lineage tree of three generations. Boxes arranged diagonally do not correspond to pairs with unique cell labels, and hence do not belong to either of the three categories. (B) Normalized dissimilarity index of Msn2 burst amplitude between M-D, GM-GD, and reference cell pairs for each glucose concentration. (C) Normalized dissimilarity index of Msn2 burst frequency between M-D, GM-GD, and reference cell pairs for each glucose concentration. (D) Normalized dissimilarity index of Msn2 burst duration between M-D, GM-GD, and reference cell pairs for each glucose concentration. Error bars represent SEM. Table S6A gives a list of all the P values obtained by comparing amplitude, frequency, and duration of Msn2 localization between M-D pairs, GM-GD pairs, and reference pairs for each glucose concentration.
