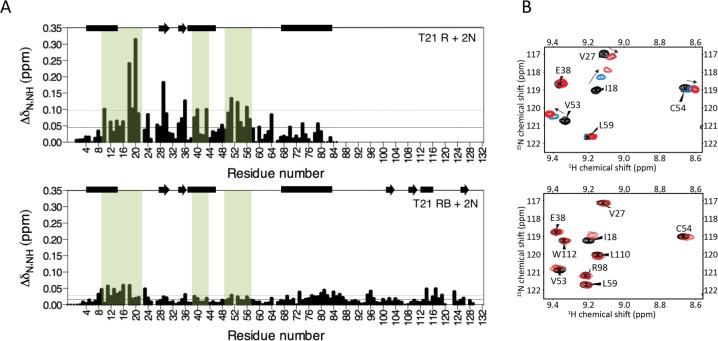
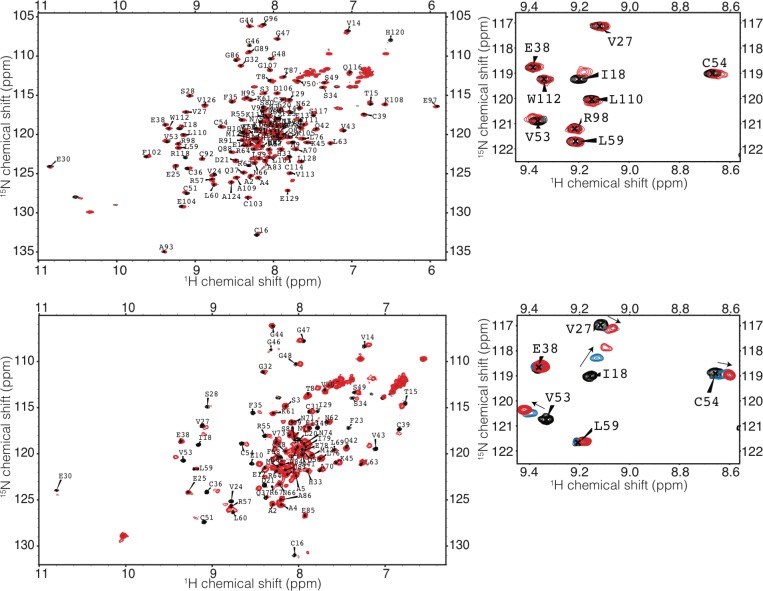
Figure 4. The Box prevents binding of E2 enzyme to the RING E3.
(A) Chemical shift perturbations recorded upon addition of unlabelled Ube2N into 15N labelled TRIM21 RING (R) (top) or RING-Box (RB) (bottom). E2 interacting regions are highlighted in green and secondary structure elements comprising either helices (rectangles) or b-strands (arrows) are indicated at the top of each plot. (B) Examples of the 15N HSQC spectra; residues in the RING (top) are shifted upon adding E2 (RING:E2 ratio: black 1:0, blue, 1:0.5, red, 1:1), while the same residues in the RING-Box (bottom) show little or no movement at a 1:1 titration point (red). Figure 4—figure supplement 1 shows the complete spectra.


