
Figure 3.
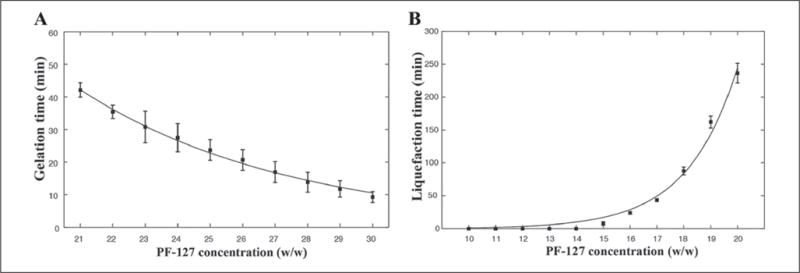
Plots showing (A) gelation time and (B) liquefaction time vs. PF-127 concentration. (A) Gelation of PF-127 solutions at different concentrations of 21%–30%. The liquid solutions initially at 4°C were placed at 37°C until gelation was observed. (B) Liquefaction of PF-127 hydrogels at different concentrations of 10%–30%. The gelled samples were maintained at room temperature (23°C) for 12 h to observe if they could reach the liquid phase. All samples at concentrations of >20% did not show any liquefaction and hence were not included in the graph.