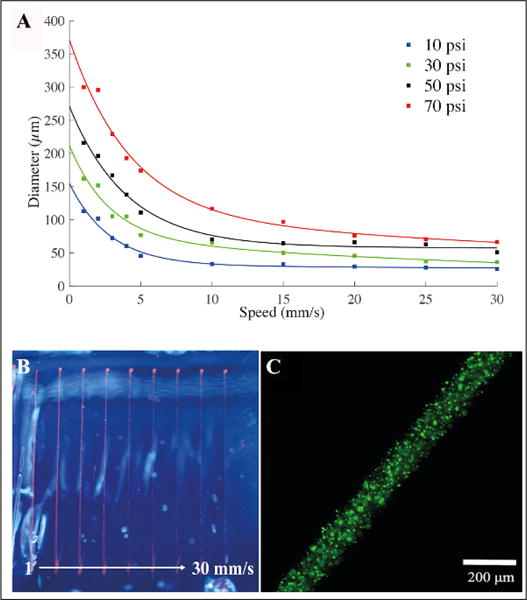
Figure 4.

Characterization of the filament diameter vs. nozzle speed and pressure. (A) Patterns consisting of 10 straight lines each with a different nozzle moving speed ranging from 1 to 30 mm/s were bioprinted inside the PF-127 supporting hydrogel bath. The same patterns were bioprinted again for different pressures, from 10 to 70 psi. (B) Top view of the alginate lines bioprinted inside the PF-127 bath at a speed of 1 up to 30 mm/s at 50 psi. (C) Fluorescence micrograph showing a line bioprinted at 70 psi and 5 mm/s.
