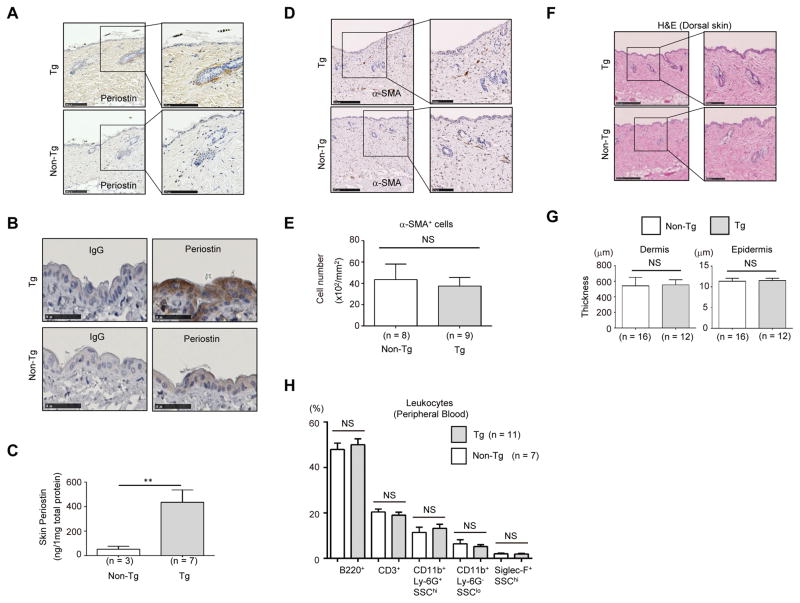
Figure 2. Histological analysis of the uninjured dorsal skin of Postn-overexpressing mice.
(A, B) Immunostaining of periostin in the dorsal skin of Postn-overexpressing (Tg) mice (upper) and non-transgenic (Tg) mice (lower). In panel B, immunostaining with anti-periostin Ab or control IgG with long exposure is depicted. Scale bars: 250 μm (A, left panels), 100 μm (A, right panels), 50 μm (B). (C) Periostin levels in dorsal skin from uninjured Tg and non-Tg mice. Protein values were calculated based on 1 mg of the homogenate protein. (D) Immunostaining of α-SMA in the dermis of Postn-overexpressing mice and non-transgenic mice. Scale bars: 250 μm (left panels), 100 μm (right panels). (E) Quantitative data of the number of α-SMA+ cells with statistical analysis. (F) H&E staining of dorsal skin from uninjured Tg (upper) and non-Tg mice (lower). Low magnification (left panel) and high magnification (right panel) images are depicted. Scale bars: 250 μm (left panels), 100 μm (right panels). (G) Quantitative data of dermis and epidermis thickness. (H) Proportions of B220+ cells (B cells), CD3+ cells (T cells), CD11b+Ly-6G+SSChigh cells (neutrophils), CD11b+Ly-6G−SSClow cells (monocytes), and Siglec-F+SSChigh cells (eosinophils) in peripheral blood leukocytes of Postn-overexpressing mice and non-transgenic mice are depicted. The data shown are the mean ± SE (C) or SD (E, G, and H). Statistical analysis was performed using a one-sided, Mann-Whitney t-test; **p < 0.01 versus non-transgenic. NS; not significant

