
Figure 1.
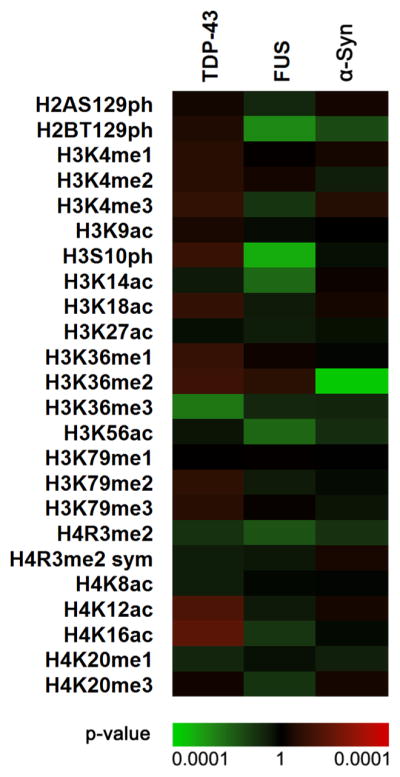
Histone modifications are altered in the context of yeast overexpressing TDP-43, FUS, and α-synuclein (α-Syn). Shown are p values for the ratios of histone H2A, H2B, H3, and H4 PTM abundances in yeast strains expressing TDP-43, FUS, and α-Syn relative to control cells. The scale is based on p values derived from statistical analysis of Western blotting experiments. The p values were calculated using a two-tailed t test with Welch’s modification. Green indicates more statistically significant decreased modification levels, while red indicates more statistically significant increased modification levels.