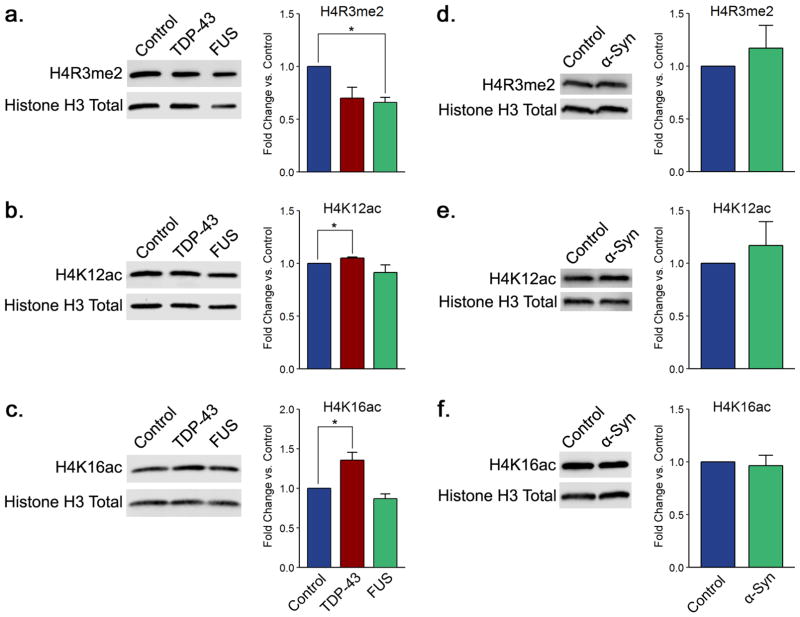
Figure 4.
FUS and TDP-43 overexpression correlate with changes in arginine dimethylation and lysine acetylation of histone H4. Shown are representative immunoblots displaying the levels of (a, d) H4R3me2, (b, e) H4K12ac, and (c, f) H4K16ac for TDP-43 and FUS and for α-synuclein yeast proteinopathy models, respectively. Quantitation histograms compiling multiple biological replicates are presented alongside the blots. All of the graphs display the mean fold change in modification levels for each group based on densitometric analysis of Western blots. Error bars indicate +SEM (n = 3–6) for each modification. *, p < 0.05.

