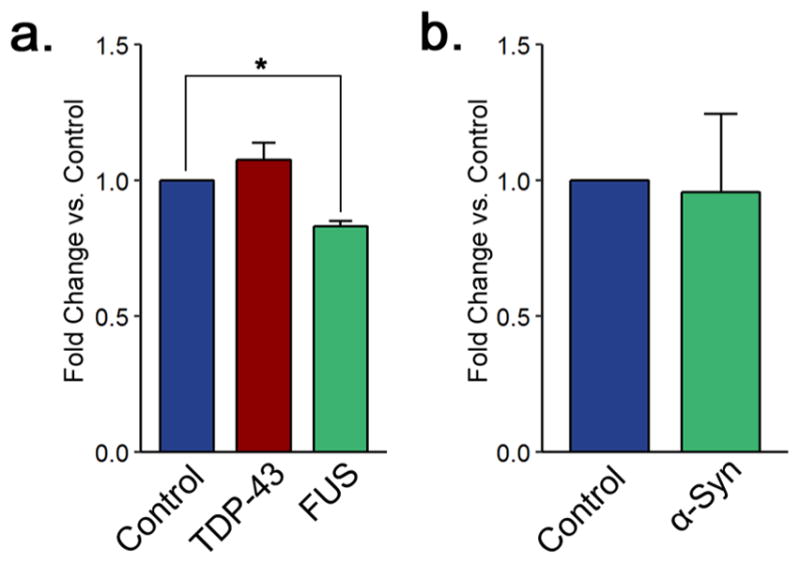
Figure 6.

RNA levels are decreased in a FUS overexpression ALS model. (a) Total RNA levels in yeast control cells and cells overexpressing TDP-43 and FUS. (b) Total RNA levels in yeast control cells and cells overexpressing α-synuclein. All of the graphs display the mean fold change in total RNA levels for each group. Error bars indicate +SEM (n = 3) for each group. *, p < 0.05.
