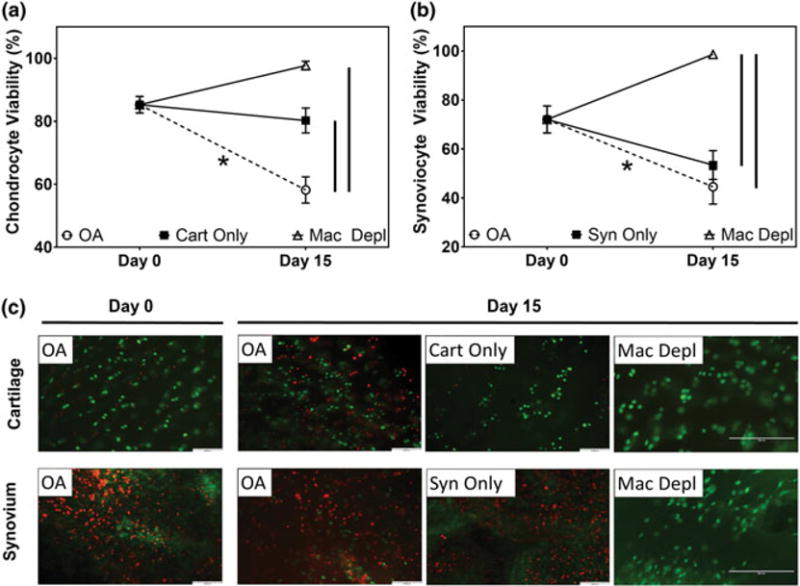
FIGURE 2.

Viability assessments of osteoarthritic cartilage and synovium cocultures. Semiquantitative analysis of (a) articular chondrocyte and (b) synoviocyte viability determined via histological analysis using Live/Dead staining of osteoarthritic joint tissues (n = 5 per study group per time-point) at Day 0 and 15 days of culture. (c) Representative Live/Dead images [scale bar = 100 μm for osteoarthritis (OA), cartilage biopsies only (cart only), synovium biopsies only (syn only) groups, scale bar = 200 μm for macrophage depleted (mac depl) group] of cocultured cartilage and synovium biopsies from samples analysed (n = 5 per study group per time-point; green = viable cells, red = dead cells). * indicates statistical difference comparing between Day 0 and Day 15 within the same study group (p < .05). Vertical lines indicate a statistical difference between connected study groups at Day 15 (p < .05) [Colour figure can be viewed at wileyonlinelibrary.com]
