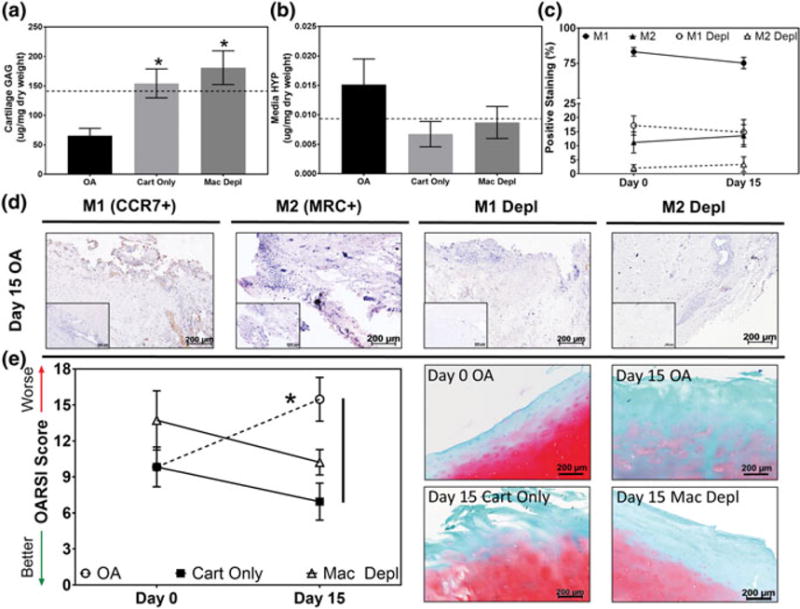
FIGURE 3.

Biochemical and histological assessments of osteoarthritic cartilage and synovium cocultures in the presence or absence of synovial macrophages. Quantitative analysis of (a) articular cartilage glycosaminoglycan (GAG) and (a) media hydroxyproline (HYP) content in osteoarthritis (OA), cartilage only and macrophage depleted (Mac Depl) cocultures following 15 days of coculture (n = 5 per study group per time-point). Dotted line indicates Day 0 GAG or HYP content. *Indicates statistical difference comparing between the OA study group at Day 15 (p < .05). (c) Semiquantitative analysis illustrating the percentage of M1 and M2 polarized macrophages in native (M1: Filled circles, M2: Filled triangles) and Mac Depl (M1: Open circles, M2: Open triangles) OA synovium at Day 0 and following 15 days of coculture in each respective culture conditions (n = 5 per study group per time-point). (d) Representative histological images stained via immunohistochemistry for M1[C-C chemokine receptor Type 7 (CCR7+)] and M2[mannose receptor C (MRC+)] polarized macrophages following 15 days of coculture (n = 5 per study group per time-point). Brown = positive staining; inserts = negative controls; scale bar = 200 μm. (e) Representative histological images (right) and semiquantitative Osteoarthritis Research Society International (OARSI) scoring analysis (left) of safranin-O stained cartilage biopsies (n = 5 per study group per time-point; red = proteoglycan, green = collagen) at Day 0 and following coculture in the respective study groups for 15 days. *indicates statistical difference comparing between Day 0 and Day 15 within the same study group (p < .05). Vertical lines indicate a statistical difference between connected study groups at Day 15 (p < .05) [Colour figure can be viewed at wileyonlinelibrary.com]
