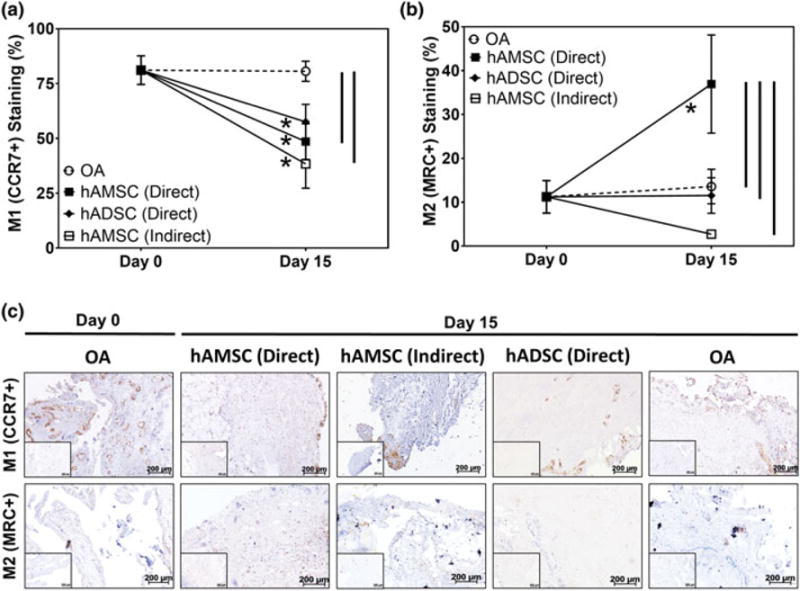
FIGURE 6.

Analysis of synovial macrophage polarization in coculture with and without human stem cells. (a) Semiquantitative analysis illustrating the percentage of M1 and M2 polarized macrophages in cocultures with [human amniotic stem cell (hAMSC) direct: Filled squares, human adipose stem cell (hADSC) direct; filled diamonds, and hAMSC indirect; open squares] and without stem cells [osteoarthritis (OA); open circles] at Day 0 and following 15 days of coculture in respective culture conditions (n = 5 per study group per time-point). * indicates statistical difference comparing between Day 0 and Day 15 within the same study group (p < .05). Vertical lines indicate a statistical difference between connected study groups at Day 15 (p < .05). (d) Representative histological images stained via immunohistochemistry for M1[C-C chemokine receptor Type 7 (CCR7+)] and M2[mannose receptor C (MRC+)] polarized macrophages following 15 days of coculture (n = 5 per study group per time-point). Brown = positive staining, inserts = negative controls, scale bar = 200 μm [Colour figure can be viewed at wileyonlinelibrary.com]
