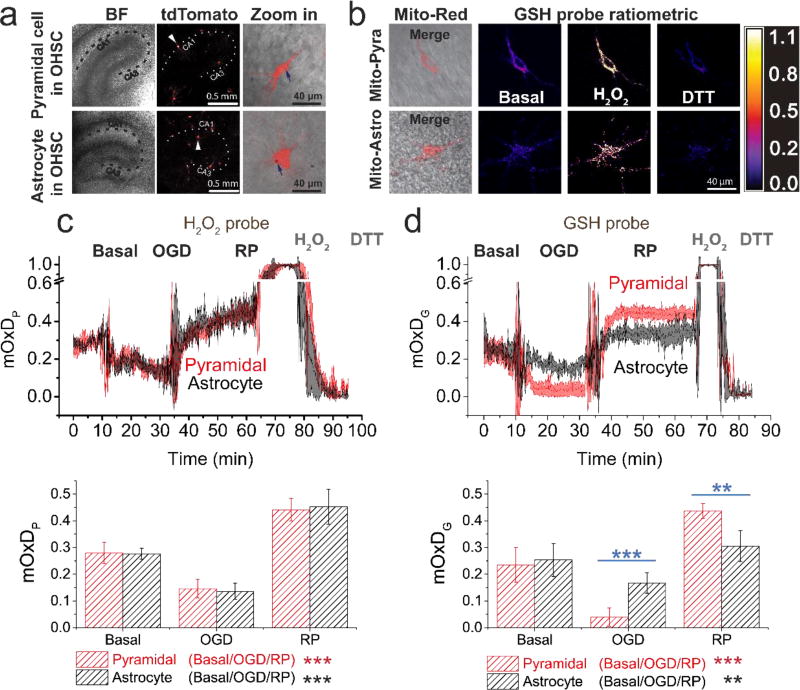
Figure 2. Pyramidal and astrocyte mitochondrial H2O2 respond similarly and GSH systems respond differently to OGD-RP.
(a) Demonstration of the expression of tdTomato (Ex: 561 nm, Em: 580–600 nm) fluorescent protein in a pyramidal cell (top) and an astrocyte (bottom) from OHSCs (gene gun). (Left) bright field (BF) image of the OHSC and (middle) fluorescence image of tdTomato are taken with a 5× objective lens. The dotted line indicates approximately the Cornu Ammonis (CA). (Right) Enlarged images of single cells (indicated by arrows in the middle image) are taken with a the 63× objective lens (see Figure 1). Gold particles (see blue arrow) carrying plasmids were introduced to the cell by gene gun. (b) Representative images of a pyramidal cell (top) and an astrocyte (bottom) expressing mitochondrially-targeted fluorescent protein. (Left) overlay of BF image and fluorescence image of and Mito-Red (Ex: 561 nm, Em: 580–600 nm). (Middle/right) ratiometric images of the mitochondrial GSH probe (Mito-GP, Ex: 405/488 nm, Em: 500–530 nm) at basal, H2O2, and DTT treatment. (c–d) (Top) the OxD derived from the fluorescence measurements during OGD-RP. OHSCs were sequentially treated with 10 min basal/20 min OGD/30 min RP followed by H2O2 and DTT sequentially for calibration. Data are represented as mean ± SEM from six separate experiments (see Eq. S6 – S9 in Supporting Information). (Bottom) Comparisons of OxD values taken from the last five minutes at each condition (prior to the visible transients in the data trace above). Student’s t-test and one-way ANOVA were applied (no symbol if p > 0.05, *p < 0.05, **p < 0.01, ***p<0.001, n = 6 for each case). Symbols above the horizontal lines represent the comparisons between different cell types. Symbols in the legend below the bar chart represent the ANOVA comparisons among the OGD-RP periods.

