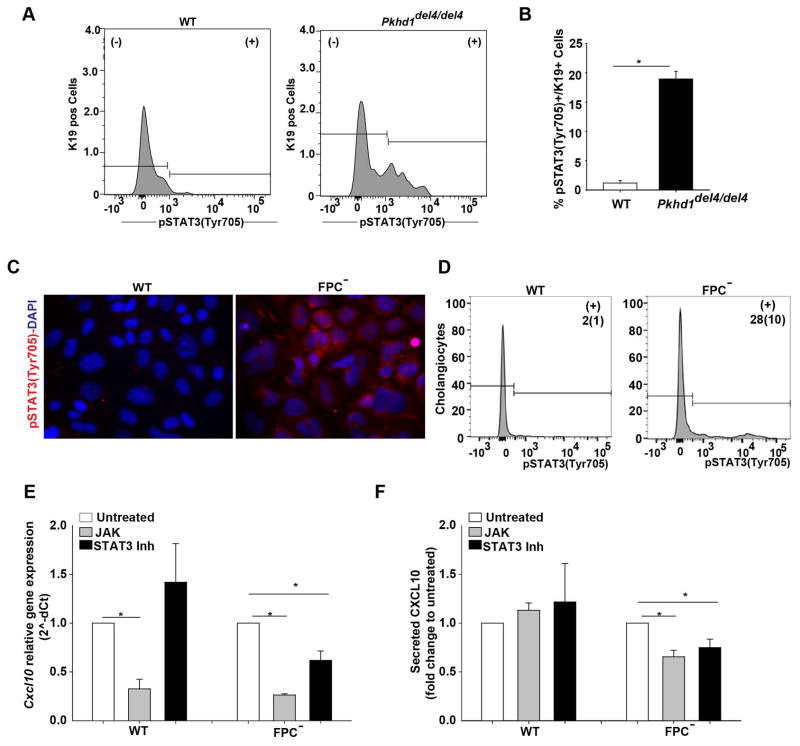
Figure 3. In FPC-defective cholangiocytes an increased pSTAT3(Tyr705) is responsible for CXCL10 production.
A) FACS analysis in the liver of 3 months old WT/Pkhd1del4/del4 mice shows increased number of Cholangiocytes (K19+Cells) that express pSTAT3(Tyr705) in Pkhd1del4/del4 (n=3) compared to WT mice (n=3). B) Bar graph showing the quantification of FACS analysis results. C) Immunocytochemistry for pSTAT3(Tyr705) (red) in WT and FPC-defective cholangiocytes (FPC−) showed cytoplasmic and nuclear expression only in FPC-defective cholangiocytes. Nuclei were stained with DAPI (blue). D) FACS analysis for pSTAT3(Tyr705) in the cultured WT and FPC-defective cholangiocytes showed increased expression of pSTAT3(Tyr705) in FPC-defective cholangiocytes as compared to WT cells. The number in (+) fraction for pSTAT3 are mean(SD) of % pSTAT3+ Cholangiocytes. E, F) In vitro treatment of WT (n=7) and FPC-defective cholangiocytes (n=8) with inhibitor of JAK or STAT3 activation for 24 hours reduced Cxcl10 gene expression as assessed by RT-PCR and CXCL10 protein levels as assessed by ELISA in the cell supernatant compared to untreated cells only in FPC-defective cholangiocytes. The results in graph E and F are presented as fold change to untreated cells and the statistics were performed with the one sample Ttest. (*p<0.05, unpaired Students Ttest). K19: Cytokeratin-19, FPC−: Fibrocystin-defective cholangiocytes.

