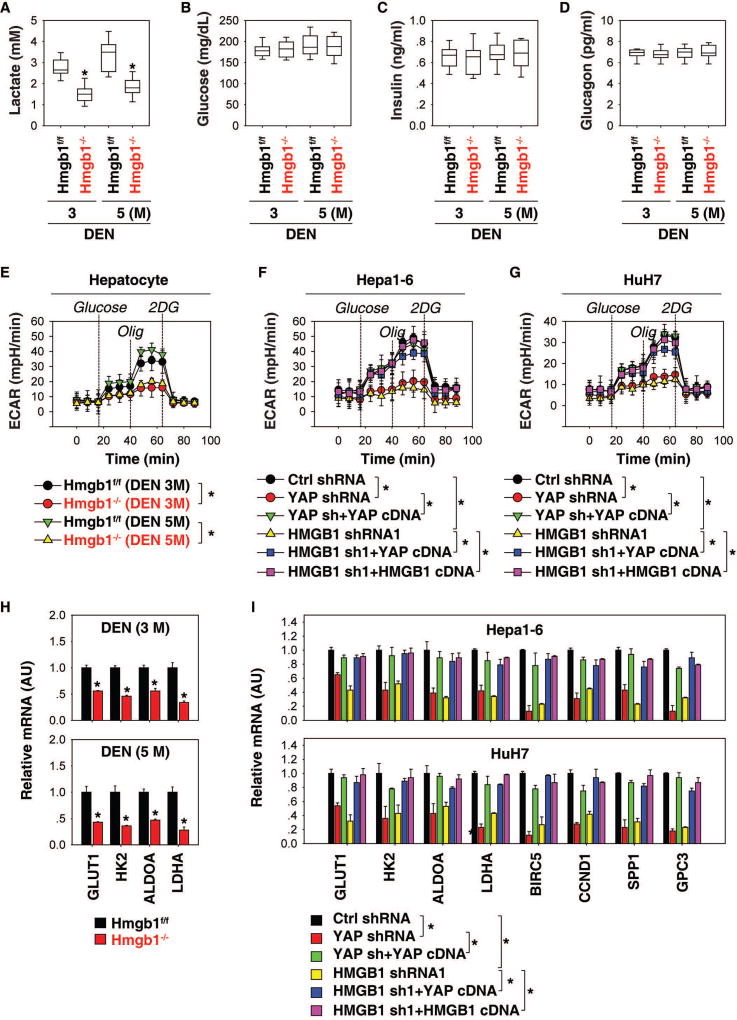
Fig. 4. The HMGB1-YAP pathway mediates the Warburg effect.
(A–D) Serum levels of lactate (A), glucose (B), insulin (C), and glucagon (D) in Hmgb1−/− and Hmgb1f/f mice after DEN treatment for three and five months (n=10 mice for each time point. *p<0.05 versus Hmgb1f/f group). (E–G) Analysis of ECAR in indicated hepatocytes or HCC cells (n=3, *p < 0.05). (H) Q-PCR analysis of mRNA expressions of indicated genes in livers from Hmgb1−/− and Hmgb1f/f mice after DEN treatment for three and five months (n=3 mice for each time point. *p<0.05 versus Hmgb1f/f group). (I) Q-PCR analysis of mRNA expressions of indicated genes in indicated Hepa1-6 and HuH7 cells (n=3, *p<0.05).

