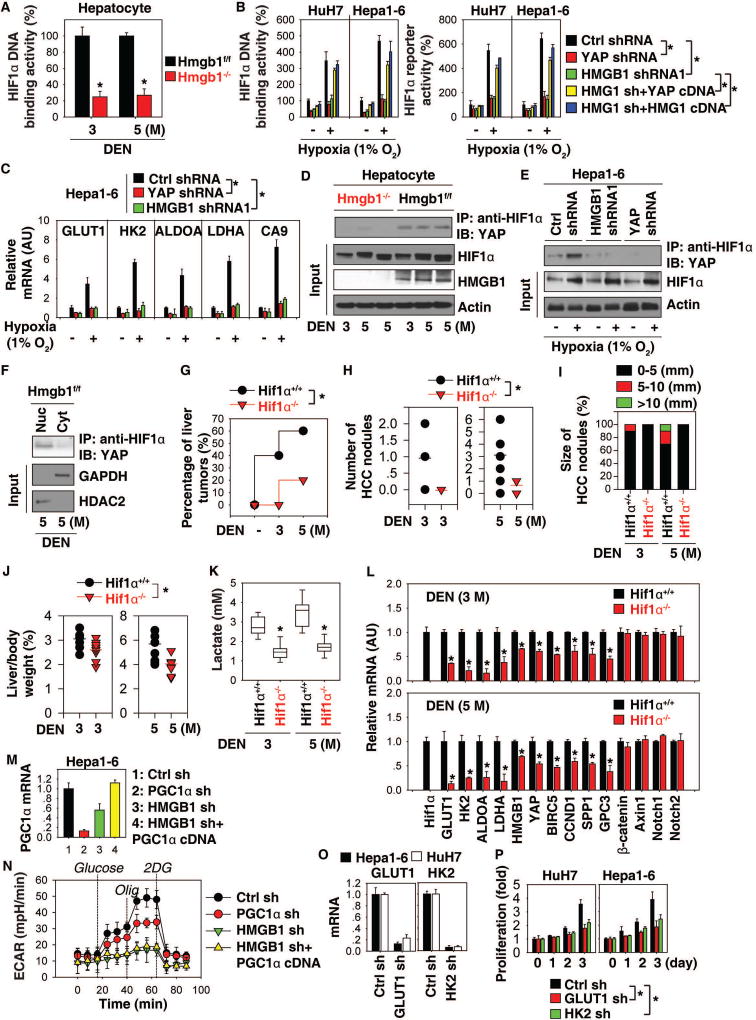
Fig. 5. Interplay between HMGB1, YAP, and HIF1α contributes to liver tumorigenesis.
(A) HIF1α DNA binding activity in hepatocytes from Hmgb1−/− and Hmgb1f/f mice after DEN treatment for three and five months (n=3 mice for each time point. *p<0.05 versus Hmgb1f/f group). (B, C) HIF1α activity and glycolysis-associated gene expression in indicated HCC cells with or without hypoxia (1% O2) treatment for 24 hours (n=3, *p<0.05). (D) Immunoprecipitation (IP) analysis of HIF1α-YAP complex in hepatocytes from Hmgb1−/− and Hmgb1f/f mice after DEN treatment for three and five months. (E) IP analysis of HIF1α-YAP complex in Hepa1-6 cells with or without hypoxia (1% O2) treatment for 24 hours. (F) IP analysis of HIF1α-YAP complex in nuclear (“Nuc”) or cytoplasmic (“Cyt”) extractions of hepatocytes from Hmgb1f/f mice after DEN treatment for five months. (G) Percentage of liver tumors in Hif1α−/− and Hif1α+/+ mice after DEN treatment for three to five months (n=10 for each group, *p<0.05). (H–J) Number (H) and size (I) of HCC nodules as well as liver weight (J) in Hif1α−/− and Hif1α+/+ mice at three to five months of age (n=10 for each group, *p<0.05). (K) Serum level of lactate in Hif1α−/− and Hif1α+/+ mice after DEN treatment for three and five months (n=10 mice for each time point. *p<0.05 versus Hif1α+/+ group). (L) Q-PCR analysis of mRNA expressions of indicated genes in livers from Hif1α−/− and Hif1α+/+ mice after DEN treatment for three and five months (n=3 mice for each time point. *p<0.05 versus Hif1α+/+ group). (M, N) Levels of PGC1α mRNA expression and ECAR in indicated Hepa1-6 cells. (O–P) Knockdown of GLUT1 or HK2 inhibited cell proliferation in indicated HCC cells (n=3, *p<0.05).

