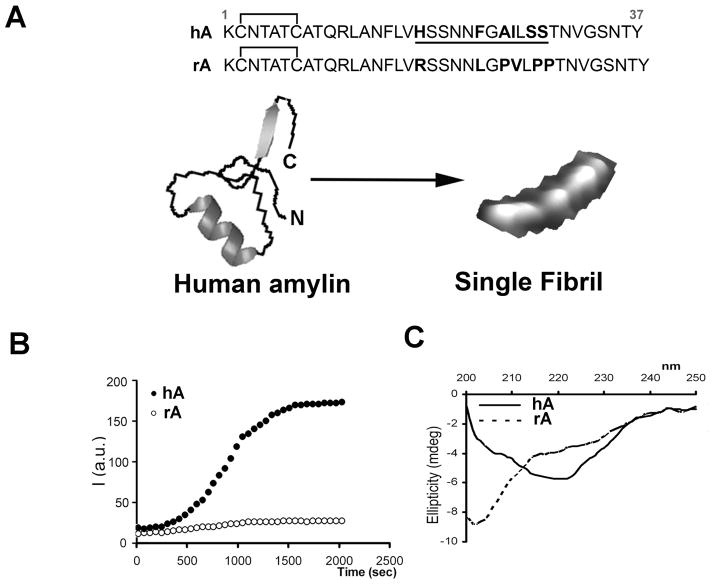
Figure 1. Dynamics of hA aggregation and misfolding in solution.
(A) Primary structures of mature forms of hA and rA are shown. Species-specific amino-acids within the amyloidoigenic region (underlined) of the two polypeptide chains are bolded for clarity. (B) Kinetics and extent of aggregation of human and rA in buffer as a function of time. Thioflavin-T fluorescent assay reveals fibrilogenesis of 20μM hA in solution (closed circles) and lack of aggregation of non-amyloidogenic rA (20μM; open circles). (C) Far-UV CD spectra of hA (solid line) and rA (dashed line) taken after 20 min. in PBS solution in the presence of 2% HFIP. Note the absorption minimum at ~220nm for hA but not rA, typical for peptides and proteins adopting β-sheet conformation.

