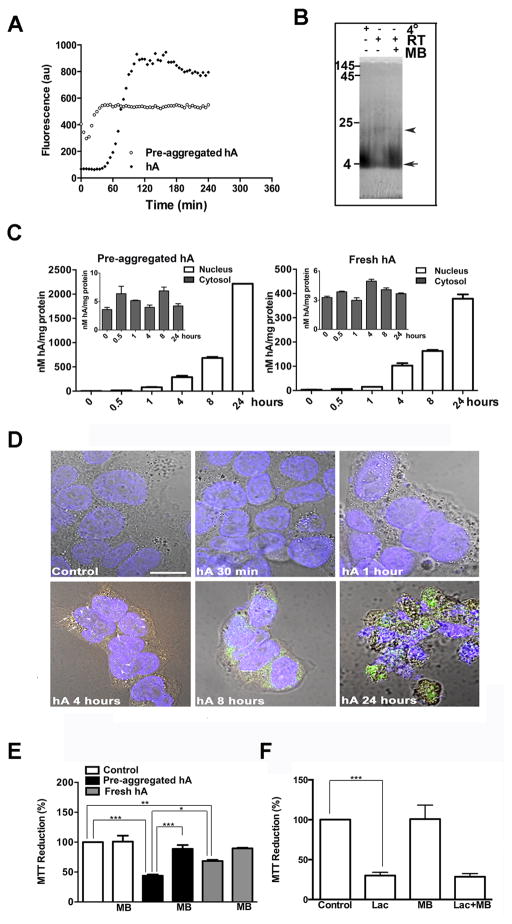
Figure 8. Dynamics of intracellular accumulation and aggregation of hA.
(A) Time course and extent of aggregation of hA (30μM) at RT, prepared by two distinct methods is shown. Note immediate increase in ThT fluorescence, reflecting hA fibrilization in preaggregated sample (circles). In contrast, freshly prepared equimolar samples lacking aggregates (black diamonds) show delayed hA aggregation (lag phase > 1 hour). (B) Characterization of hA oligomeric state by native PAGE. Freshly prepared hA was incubated at +4°C, room temperature (RT) or in the presence of amyloid-inhibitor methylene blue (MB, 500 μM) for 4 hours. Arrow denotes monomeric hA, whereas arrowhead denotes oligomers. (C) Dynamics of hA internalization in RIN-m5F cells examined by ELISA. (D) Confocal microscopy was used to assessed kinetics and location of hA in these cells. (E) MTT cellular stress assay was used to evaluate toxicity of hA in the absence or presence of oligomeric inhibitor methylene blue (MB). (F) Effect of protein stress inducer Lactacystin (Lac, 10μM) on mitochondrial activity in the presence or absence of MB is shown. Significance was established at * p<0.05, ** p<0.01 and *** p<0.001, n=6, ANOVA followed by Tukey’s post hoc comparison test.

