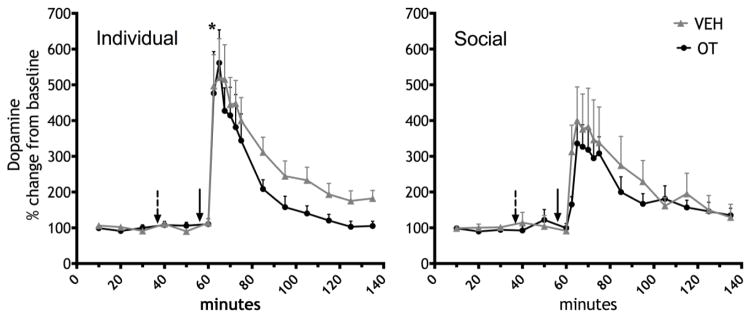
Figure 2.
Dopamine response to an i.v. infusion of METH (0.3 mg/kg in 100 μl) after VEH or OT (0.3 mg/kg, ip.). The broken arrow depicts the time point of the VEH or OT injection, the solid arrow shows the time point of the METH infusion. (*p<0.05, difference between individual (left) and social (right) housing conditions for that time point).

