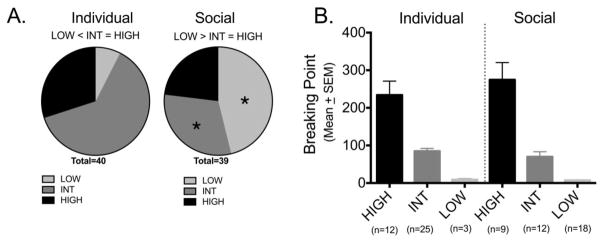
Figure 5.
Individual variability in BP varied with housing conditions. (A) Pie charts of the distribution of the number of animals within the individually and socially housed groups falling in the HIGH, INT (Intermediate) or LOW category. *p<0.05; significant difference between the number of individually housed and socially housed rats in the corresponding categories. (B) Group means (± SEM) of breaking points for individually housed and socially housed females within each category.

