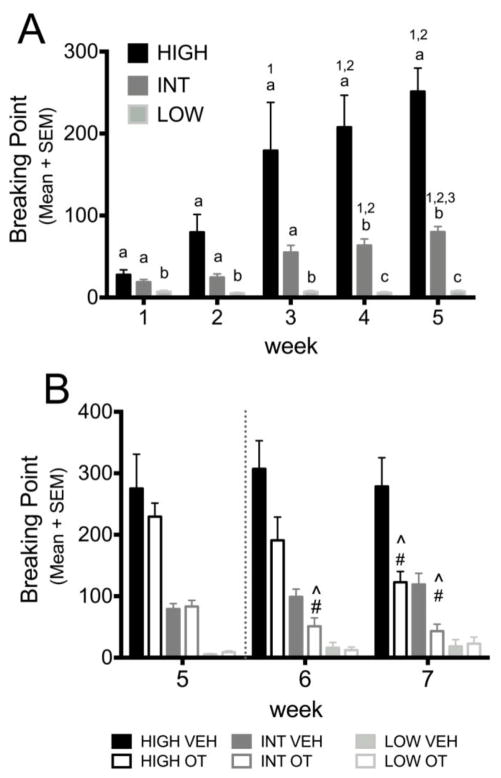
Figure 6.
Effect of Individual Variability on the effect of OT on BP. (A). Group means ± SEM for each week. Different letters above the bars indicate a significant difference between categories within a week (a,b,c p<0.005). 1,2 and 3 indicate a significant difference from week 1, 2 and 3 resp. within a category (1,2,3p<0.05). (B) Effects of OT treatment within that week and category (#p<0.005), ^ depict a significant difference from week 5 within that category and treatment group (^p<0.05).

