
Figure 2.
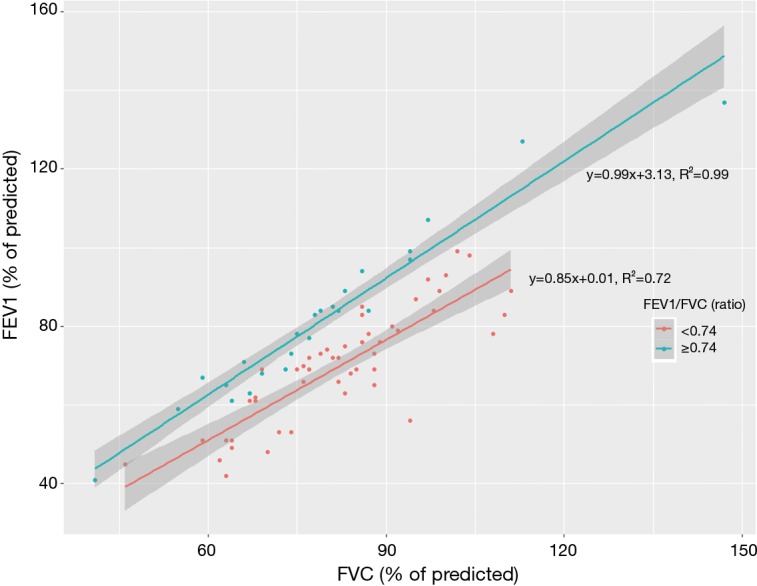
Scatter plot and trend lines between FVC (% of predicted) and FEV1 (% of predicted) in patients with FEV1/FVC ratios <0.74 vs. those with FEV1/FVC ratios ≥0.74. FVC, forced volume vital capacity; FEV1, forced expiratory volume in 1 second.
Official websites use .gov
A
.gov website belongs to an official
government organization in the United States.
Secure .gov websites use HTTPS
A lock (
) or https:// means you've safely
connected to the .gov website. Share sensitive
information only on official, secure websites.
Scatter plot and trend lines between FVC (% of predicted) and FEV1 (% of predicted) in patients with FEV1/FVC ratios <0.74 vs. those with FEV1/FVC ratios ≥0.74. FVC, forced volume vital capacity; FEV1, forced expiratory volume in 1 second.