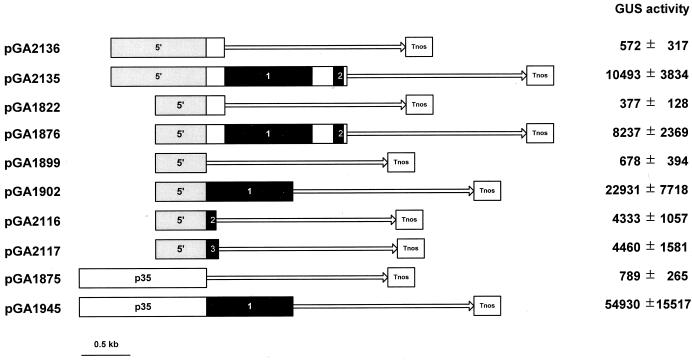
Figure 5.
Structures of the tested GUS fusion constructs and GUS activity in the calli carrying them. Numbers 1, 2, and 3 in black bars indicate introns 1, 2, and 3 of OsTubA1, respectively. Gray bars represent the 5′-upstream sequence of OsTubA1, and white bars indicate the p35 cauliflower mosaic virus 35S promoter. Exons of OsTubA1 are shown in white bars, and the GUS coding region is shown with a solid line with an arrow. Tnos signifies the nos terminator. GUS values are expressed as pmol 4-MU min−1 mg−1 soluble protein.

