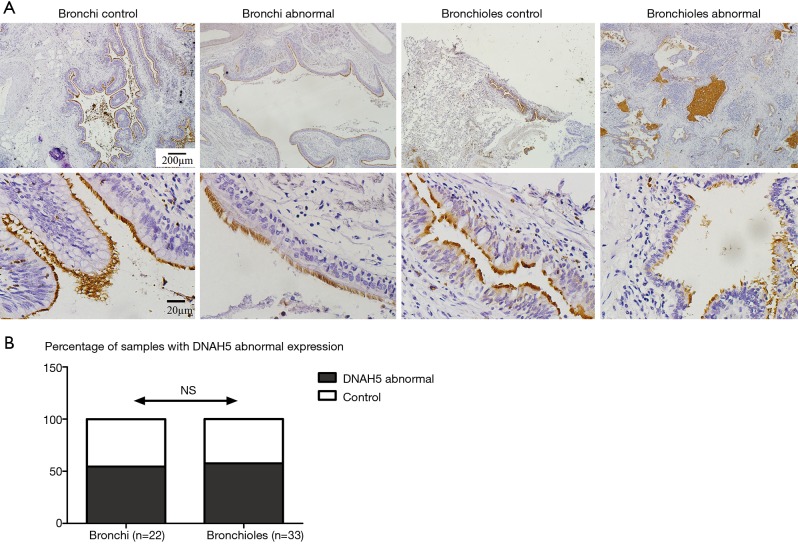
Figure 4.
Abnormal DNAH5 expression pattern. DNAH5 was evaluated by IHC staining (A, upper: ×40 amplifications; scale bar =200 µm; down: ×400 amplifications; scale bar =20 µm). Statistical analysis was performed in non-hyperplastic and hyperplastic epithelium in bronchi and bronchioles in DNAH5 expression (B, Fisher exact test).

