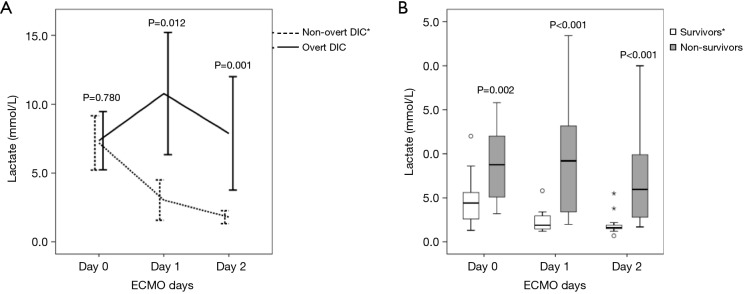
Figure 4.
Changes in lactate levels in patients with pre-ECMO overt DIC and non-overt DIC (A), and between survivors and non-survivors (B). Whisker plots (A) represent minimum and maximum values, and box and whisker plots (B) represent minimum, first quartile, median, third quartile, and maximum values. *, P<0.05 by repeated measures ANOVA for changes in each group during the 48 h of ECMO support. DIC, disseminated intravascular coagulation; ECMO, extracorporeal membrane oxygenation.

