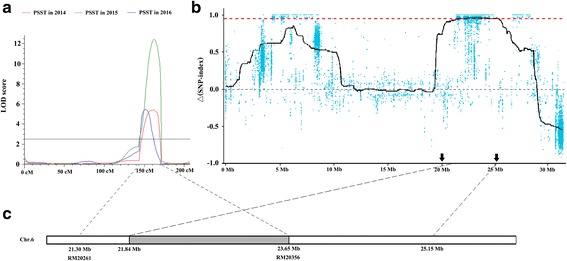
Fig. 4.

Mapping of qPSST6 on chromosome 6 using the methods of QTL analysis and Seq-BSA. a: qPSST6 detected in the RIL population by using the ICIM module of QTL IciMapping 3.2. The LOD scores are shown with three distinct peaks corresponding to qPSST6 in 2014, 2015 and 2016, respectively. b: hot-region for PSST identified by SNP-index method on chromosome 6. The black line shows the Δ (SNP-index) value of fitting results. The red dotted line shows the association threshold value (0.9532), and the black arrows on the x-axis represent the location of hot-region for PSST. c: the intersection of qPSST6 interval identified by QTL analysis and Seq-BSA. The gray region on the chromosome shows the 1.81 Mb intersection of qPSST6
