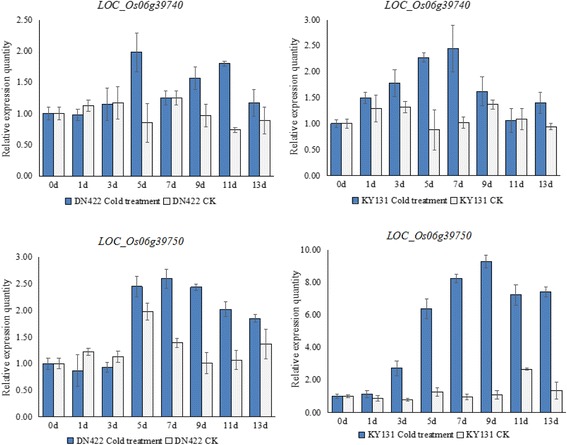
Fig. 5.

Expression patterns of LOC_Os06g39740 and LOC_Os06g39750 under the conditions of cold water irrigation and CK. Each line with different patterns on the X-axes from left to right indicate the sampling times of 0, 1, 3, 5, 7, 9, 11 and 13 day after cold water irrigating in KY131 and DN422. The Y-axes indicate the relative expression quantity. The error bars indicate SD for the data obtained in three biological replicates
