Fig. 6.
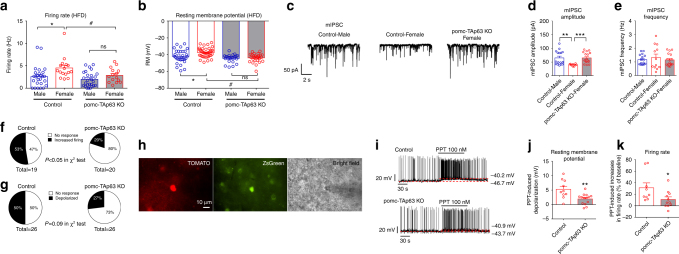
Selective deletion of TAp63 in POMC neurons impairs neural activities of POMC neurons. a Firing rate, recorded by the whole-cell patch clamp, in POMC neurons from male and female mice, with or without POMC-specific TAp63 deletion, that have been fed with HFD for 4 weeks. Data are presented as mean ± SEM with individual data points. N = 15–26 per group. *P < 0.05 between male and female with the same genotype; #P < 0.05 between the two genotypes with the same sex in two-way ANOVA followed by post hoc Sidak tests. b Resting membrane potential, recorded by the perforated patch clamp, in POMC neurons from male and female mice, with or without POMC-specific TAp63 deletion, that have been fed with HFD for 4 weeks. Data are presented as mean ± SEM with individual data points. N = 22–39 per group. *P < 0.05 between male and female with the same genotype; #P < 0.05 between the two genotypes with the same sex in two-way ANOVA followed by post hoc Sidak tests. c Typical mIPSC recorded from the POMC neurons of control male, control female, or pomc-TAp63 KO female mice that have been fed with HFD for 4 weeks. d, e Amplitude (d) and frequency (e) of mIPSC in POMC neurons. Data are presented as mean ± SEM with individual data points. N = 10–17 per group. **P < 0.01 or ***P < 0.001 in one-way ANOVA followed by Sidak tests. f, g Percentage of POMC neurons from control and pomc-TAp63 KO mice that were activated by PPT. PPT-induced activation was defined as either > 20% increases in firing rate (f) or by > 2 mV depolarization (g). h Fluorescence for TOMATO (left) and ZsGreen (middle), and bright-field illumination (right) of a recorded ERα-positive POMC neuron in a brain slice prepared from ERα-ZsGreen/POMC-CreERT2/Rosa26-tdTOMATO mouse with tamoxifen induction at 11 weeks of age. i Representative current clamp traces for PPT-induced responses in ERα-positive POMC neurons from control or pomc-TAp63 KO mice. j, k PPT-induced depolarization (j) and increases in firing rate (k) in ERα-positive POMC neurons from control or pomc-TAp63 KO mice. Data are presented as mean ± SEM. N = 10–14 per group. *P < 0.05 or **P < 0.01 in t-tests

