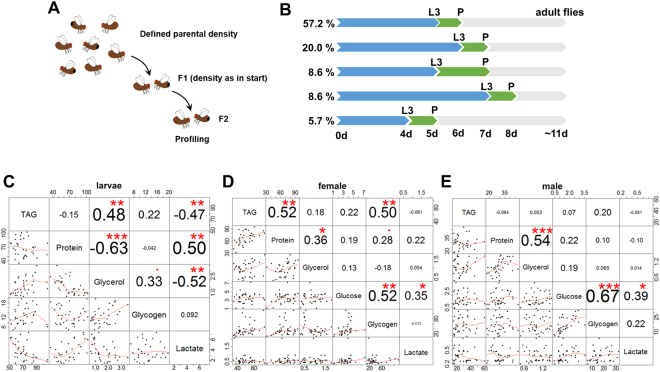
Figure 1.
Metabolic profiling of selected DGRP fly lines. (A) Experimental outline of the profiling experiment. In order to minimize environmental effects, we kept the population density constant for two generations. The subsequent offspring was metabolically profiled. Additionally, samples were collected for the gut microbiome sequencing experiments. (B) The investigated fly lines showed differences in the developmental timing. While the majority of fly lines showed the expected developmental timing, several lines showed differences in either the larval or pupal development. The adult flies hatched almost all at the same time. Late third instar larvae, female and male flies were collected and triacylglycerol (TAG), total protein, free glycerol, lactate, glycogen and glucose were measured. In order to identify linked metabolites, we performed correlation analyses for larvae (C), females (D) and males (E). Profiling experiment following scheme presented in (A) performed once. Asterisks in (C–E) indicate statistical significance levels with: *p < 0.05, **p < 0.01 and ***p < 0.001 based on t-test statistics.

