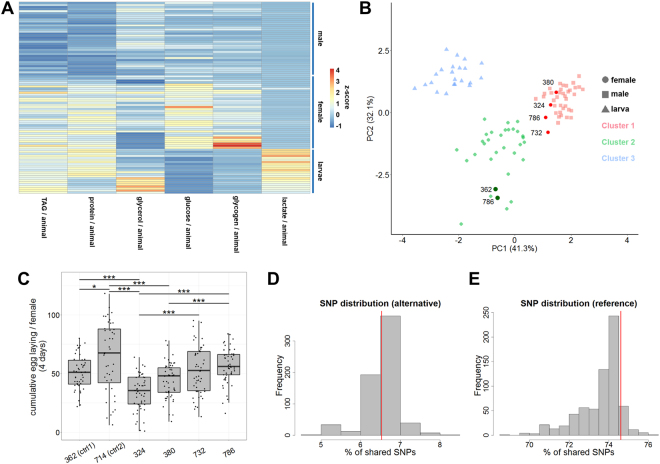
Figure 2.
Multiparametric analysis of the metabolic profiling data. (A) Heatmap showing the k-means clustered metabolite profiling results. Color coding represents the column-wise z-score normalized metabolite measurements. Each row represents a single sample. Different metabolic cohorts can be identified. (B) Principal component analysis of the metabolite profiling experiments shown in (A). The data segregates into three clearly-distinguished clusters labeled green, blue or red. The colors almost perfectly align with the samples (larvae, females and males). However, cluster 1 (males) contains four data points, which are of female origin. (C) The four DGRP lines, where female samples were assigned to the male cluster, were tested for a putative fertility phenotype. The box plots show the averaged results of three biologically independent egg-laying quantification experiments (complete experimental data shown in Supplemental table, sheet C). Significant differences based on an ANOVA analysis and Bonferroni corrected post-hoc testing are labeled by the asterisks. Significance levels: p < 0.05 *; p < 0.001 ***. In order to identify possible SNPs associated with the masculinized metabolic profile of the four DGRP lines we investigated the per cent of shared alternative (D) or reference (E) alleles. In brief, we calculated the amount of shared alleles between any two of the 35 DGRP fly lines used and plotted the results as a histogram. Subsequently, we compared the resulting distribution with the value obtained for the four masculinized DGRP lines (red line).

