Figure 3.
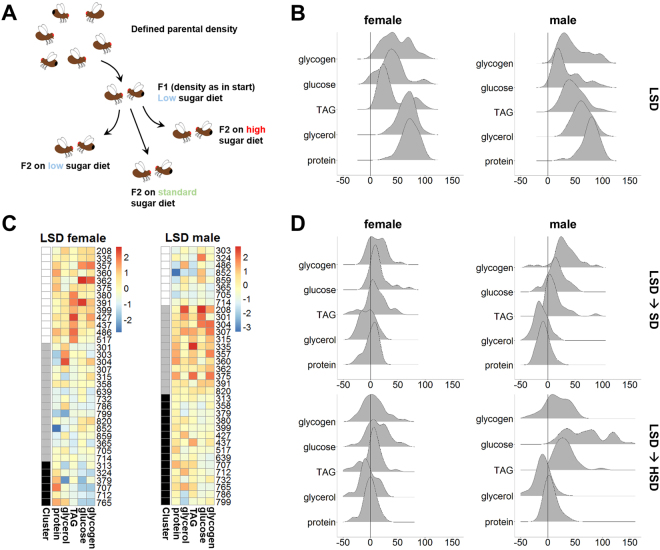
Metabolic response to a changing diet. (A) Experimental outline. As shown in Fig. 1A, we kept different DGRP fly lines under constant parental density for two generations. This time, the animals were kept on a low sugar diet. The hatched animals subsequently remained on a low sugar diet, or were shifted to richer food (standard diet or high sugar diet). (B) At the age of six days, the animals were sacrificed to measure the total protein, glycerol, triacylglycerol (TAG), glucose and glycogen content by targeted assays. For all measurements values were per cent normalized among the different fly lines. The distributions of metabolic values for the five measurements for the female and male samples are shown. (C) Heatmaps for the clustered female and male samples. (D) Density plots showing the metabolite amount differences following the shifts from low sugar diet (LSD) to standard diet (SD) or high sugar diet (HSD), respectively. Profiling data as schematized in (A) was performed once.

