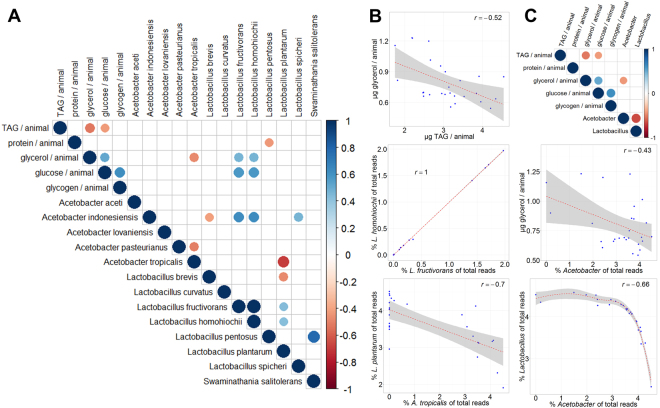
Figure 6.
Correlation between metabolic parameters and gut microbiome bacterial abundancies. All data are log transformed. The DGRP line 859 and the Wolbachia species were excluded due to fact that Wolbachia is not a natural member of the gut microbiome. (A) Correlation matrix of significant correlations (p < 0.05) between the indicated parameters and the bacterial abundancies on species level. The color code and size of the circles are proportional to the r correlation coefficient and the p-value. (B) Scatter plots of selected correlations from the correlation matrix shown in (A). The linear approximation and the confidence interval as well as the r values are shown. (C) Correlation matrix of significant correlations (p < 0.05) between the indicated parameters and the bacterial abundancies on genus level. Scatter plots of selected correlations from the correlation matrix shown above.

