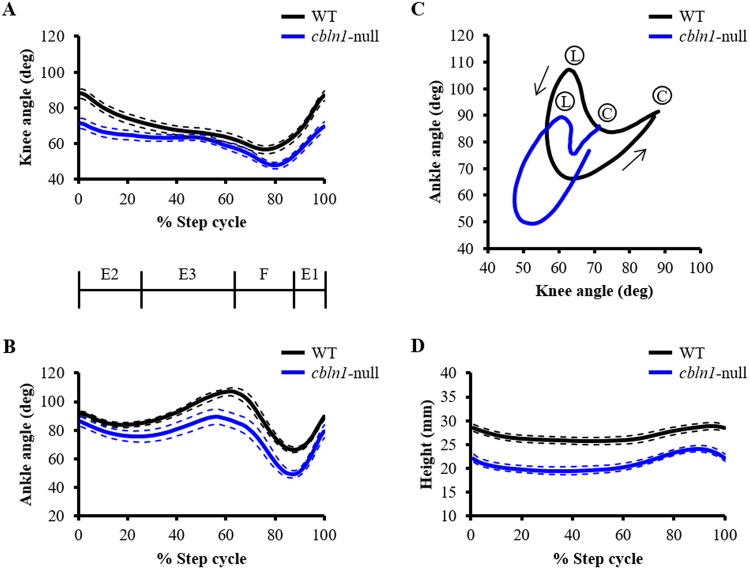
Figure 3.
Kinematics of displacement during the step cycle. (A,B) Average angular displacements during the step cycles of wild-type (WT, black line) and cbln1-null (blue line) mice. Dotted lines indicate SEM. (C) Mean interjoint coordination patterns during the step cycle. Each line illustrates the averaged data for interjoint coordination patterns of the ankle and knee joints in wild-type (WT, black line) and cbln1-null mice (blue line). C: Foot contact at the beginning of the stance phase; L: foot lift at the beginning of the swing phase. Arrows indicate the direction of angular motions. (D) Average great trochanter height displacements during the step cycle in wild-type (black line) and cbln1-null (blue line) mice. Dotted lines indicate SEM.

