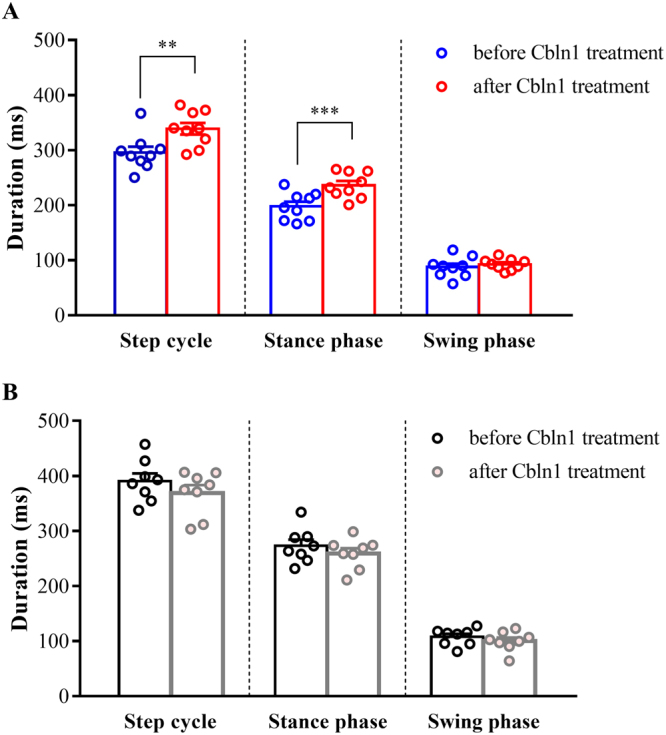
Figure 5.

Average step cycle duration after injection of Cbln1. (A) Average step cycle, stance and swing phase durations in cbln1-null mice before (before treatment, blue) and after (Cbln1-treated, red) injection of Cbln1. (B) Average step cycle, stance phase and swing phase durations in wild-type mice before (before treatment, black) and after (Cbln1-treated, gray) injection of Cbln1. Differences in durations before and after injection of Cbln1 were tested using paired t-tests. **p < 0.01, ***p < 0.001.
