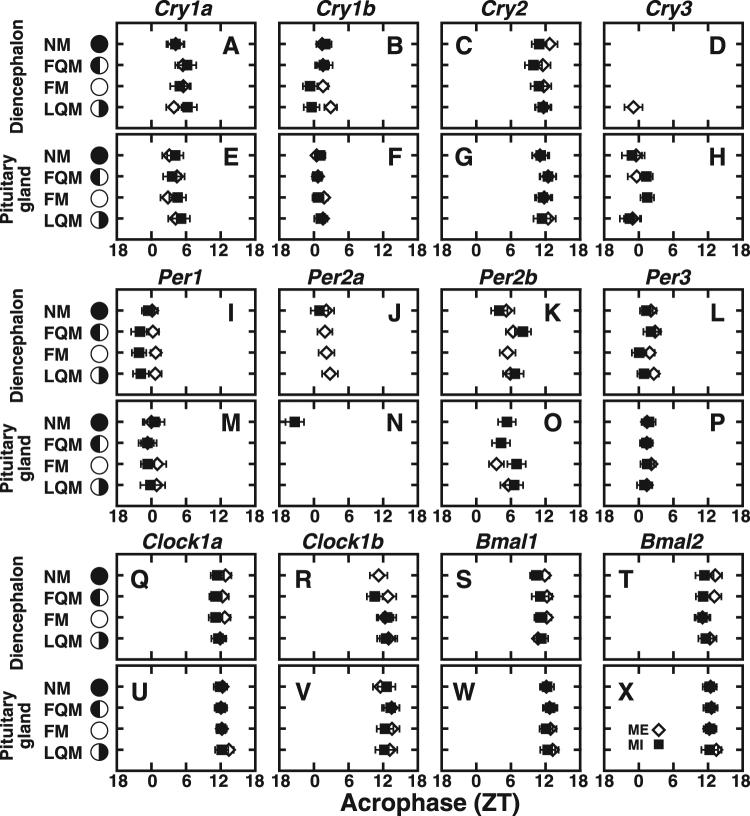
Figure 5.
Peak phases of the clock gene expression in the Goldlined spinefoot. The acrophases of the clock gene expressions for ME and MI groups at each lunar phase (Figs 2–4, S2–S4; Tables S3, S4) estimated by Cosinor analysis are plotted. Open diamonds and filled squares show ME and MI, respectively. Error bars represent ± SEM. Schematic moon images represent lunar phase (new moon, NM; first quarter moon, FQM; full moon, FM; last quarter moon, LQM).

