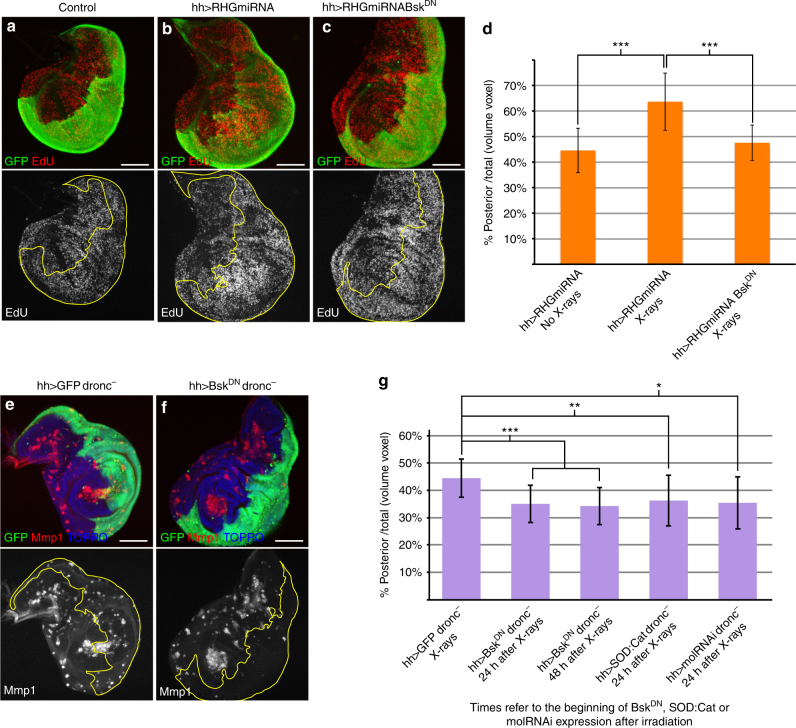
Fig. 4.
Persistent JNK activity causes overgrowths. a–c Discs of genotypes: a UAS-GFP;hh-Gal4 (n = 10), b UAS-RHGmiRNA/UAS-GFP; hh-Gal4/+(n = 20) and c UAS-BskDN; UAS-RHGmiRNA/UAS-GFP; hh-Gal4/+(n = 11) 72 h after X-rays. EdU incorporation (red) is increased in the posterior compartment (green) of b where apoptosis is suppressed by UAS-RHGmiRNA, but when JNK activity is blocked with BskDN (c), EdU incorporation is similar in both compartments, which is the normal situation (a). d Quantification of the overgrowth in UAS-RHGmiRNA/UAS-GFP;hh-Gal4/+disc (n = 32) after irradiation compared to non-irradiated discs (n = 35) (***p-value < 0.0001). Suppression of JNK by BskDN (n = 14) reverses the posterior compartment to normal size (***p-value < 0.0001), indicating that JNK is responsible for the overgrowth. e, f Discs of genotypes: e UAS-GFPtubGal80ts/+;dronci24/hh-Gal4dronci29 (n = 10) and f UAS-BskDN;UAS-GFPtubGal80ts/+;dronci24/hh-Gal4dronci29 (n = 23) 96 h after X-rays (see details of the experiment in the Methods section). Discs were stained with Mmp1 (red) to monitor JNK activity and GFP (green) to identify the P-compartment; TOPRO staining delimits the discs. The disc in e shows Mmp1 label in both compartments, but expression of the BskDN blocks JNK activity (Mmp1, red) as shown in f. g Quantification of the posterior compartment volume over the total disc volume for the genotypes: UAS-GFPtubGal80ts/+; dronci24/hh-Gal4 dronci29 (column: hh>GFPdronc− X-rays, n = 79), UAS-BskDN; UAS-GFPtubGal80ts/+;dronci24/hh-Gal4dronci29 expressing BskDN 24 h (column: hh>BskDNdronc− 24 h after X-rays, n = 43) or 48 h after irradiation (column: hh>BskDNdronc− 48 h after X-rays, n = 18). There is a significant size decrease when BskDN is expressed 24 h and 48 h after irradiation (***p-value < 0.0001), indicating that inhibiting JNK after irradiation suppresses overgrowth. Quantification for the genotypes: UAS-GFPtubGal80ts/UAS-SOD:UAS-Cat;dronci24/hh-Gal4dronci29 (column: hh>SOD:Cat dronc− 24 h after X-rays, n = 14) inducing the expression of SOD:Cat 24 h after irradiation and UAS-GFPtubGal80ts/UAS-molRNAi; dronci24/hh-Gal4dronci29 (column: hh>molRNAidronc− 24 h after X-rays, n = 7) inducing the expression of molRNAi 24 h after irradiation. There is a significant size decrease after the expression of SOD:Cat and the inhibition of mol (**p-value < 0.001 and *p-value < 0.02, respectively), indicating that ROS levels are important to maintain JNK overgrowth. Columns in the graphs represent mean ± s.d. Statistical test used: Mann–Whitney U-test. Scale bars are 100 μm

