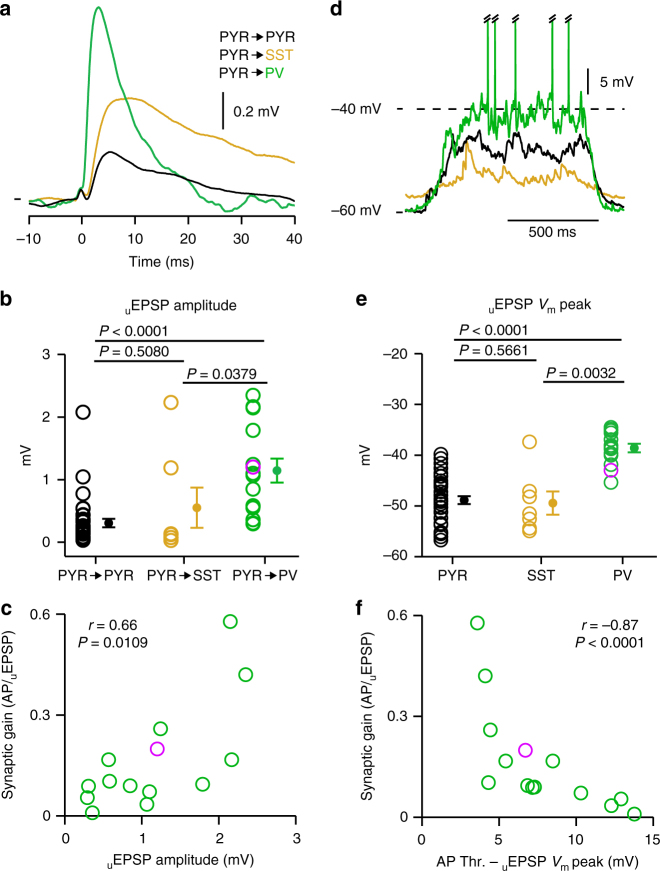
Fig. 4.
Synaptic and membrane determinants of precisely timed uEPSP-evoked action potentials. a Population average uEPSPs during UPstate (black trace shows PYR to PYR neuron = 35 connections, orange trace shows PYR to SST neuron = 7 connections, green trace shows PYR to PV neuron = 14 connections). Vm marks show PYR-PYR: −51.7 mV, PYR-SST: −50.5 mV, PYR-PV: −45.7 mV. b The amplitude of mean uEPSP is larger in PV neurons than in PYR or SST neurons. Open circles represent single connection, purple circle shows connection in an awake mouse, filled circle with error bars shows mean ± s.e.m. c The synaptic gain of PV neurons is positively correlated with the mean uEPSP amplitude, open circles represent a single connection, purple shows awake data, statistical values were taken from a linear correlation between Ln(synaptic gain) and uEPSP amplitude. d Example Vm traces shows larger amplitude and more depolarized UPstate in a PV neuron (green, APs truncated) than in a PYR neuron (black) or a SST neuron (orange). e The mean uEPSP Vm peak is significantly more depolarized in PV neurons than in SST or PYR neurons. f PV neuron synaptic gain is correlated with the difference between AP threshold (AP Thr.) and the uEPSP Vm peak of the postsynaptic response in a 5-ms window after the presynaptic AP, the linear correlation was performed between Ln(synaptic gain) and (AP Thr.- uEPSP Vm peak)

