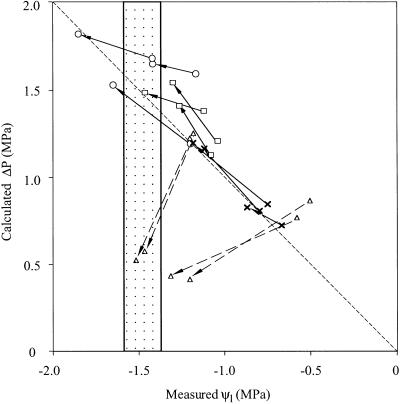
Figure 3.
Calculated ΔP versus measured Ψ1 in E. regnans (×), T. australis (▵), D. dacrydioides (□), and N. fleurii (○). Arrows indicate the change in Ψ1 before and during root chilling in the various individuals. The stippled region of the graph indicates the mean Ψcav50% ± se for T. australis. Ψcav50% in other species was less than −2 MPa. Note that only in T. australis does predicted ΔP deviate strongly from measured Ψ1 after root chilling.

