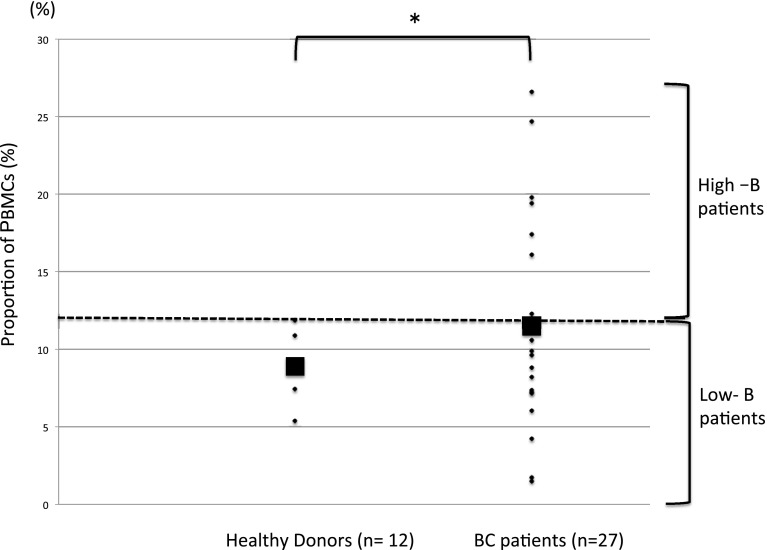
Fig. 2.
Strip chart showing the proportion of total PMBCs that are defined as B cells (CD45+/CD19+) in healthy donors and BC patients. The filled square denotes the group medians. The dashed line marks the highest recorded proportion of B cells in the healthy controls, and defines the boundary between the ‘High-B’ and ‘Low-B’ groups. *p < 0.05

