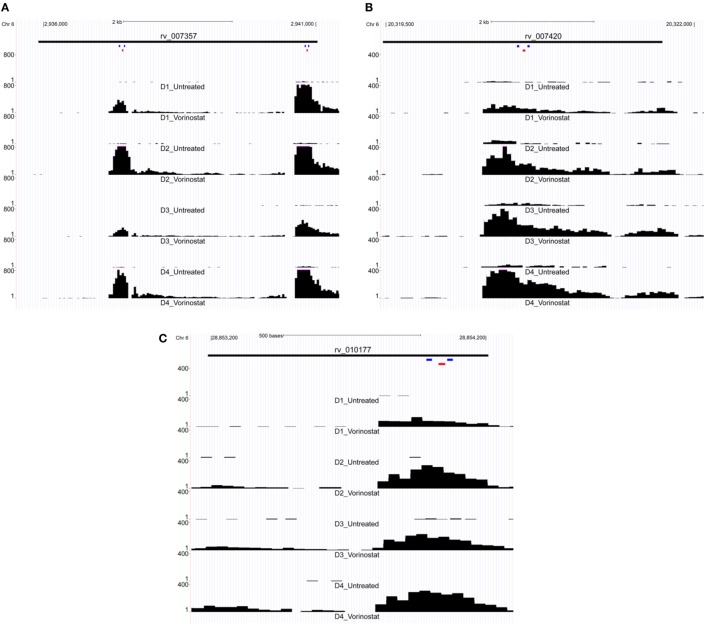
Figure 2.
Expression of LTR12 elements visualized as read pile up using the UCSC genome browser. Reads from the total RNA-Seq experiment were mapped to the human genome and then uploaded to the UCSC genome browser for visualization of each LTR12 element: (A) rv_007357, (B) rv_007420, and (C) rv_010177. Read tracts are labeled with the donor and condition, e.g., D1 for Donor 1, Vorinostat for drug treated, and Untreated for the untreated control (i.e., dimethyl sulfoxide solvent alone). Chromosomal coordinates are depicted at the top of each figure, and the black bar below indicates the position of the LTR12 element. LTR12 elements are labeled with their “rv” designation from the Human Endogenous Retrovirus Database. The y-axis indicates the read level averaged over 40 bp, and the pink caps to black bars in the figure indicate reads whose numbers extended beyond the depicted scale. Small colored bars represent the position of primers (blue) and probes (red) from custom TaqMan assay used to assess the expression of LTR12 elements by droplet digital PCR. Two distinct TaqMan assays were targeted to rv_007357 (A) with a single assay against each of the remaining LTR12 elements (B,C).

