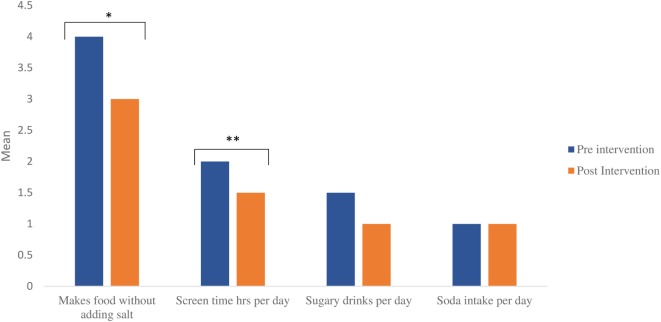
Figure 3.
Food and nutrition behaviors of shape-up and eat right families pre- and post-intervention (data for program completers). Legend: 1 = no, 2 = sometimes, 3 = often, 4 = very often, 5 = almost always; *p = 0.029, **p = 0.034; for sugary drinks and soda intake, value on Y-axis corresponds with numeric value per day.

