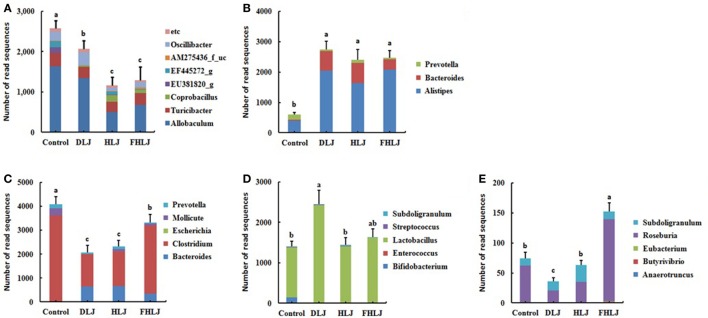
Figure 4.
The relative abundance of the functional bacterial groups in the cecal microbiota of rats (n = 4 per group). (A) Obesity-associated genera, (B) leanness-associated genera, (C) genera with pathogenic potentials, (D) genera that belong to lactic acid bacteria, and (E) butyric acid producing genera. Control: basal diet group, DLJ: basal diet + 10% dried Laminaria japonica, HLJ: basal diet + 10% dried L. japonica heat-treated at 100˚C for 30 min, FHLJ: HLJ + 0.6% fructooligosaccharide. Values are mean ± SD of the numbers of sequence reads of all OTUs belonging to each functional group. No common superscripts on the bars indicate significant difference in the relative abundance of (A) obesity-related genera, (D) genera that belong to lactic acid bacteria, and (E) butyric acid producing genera at p < 0.05, and (B) leanness-associated genera and (C) genera with pathogenic potentials at p < 0.01.

