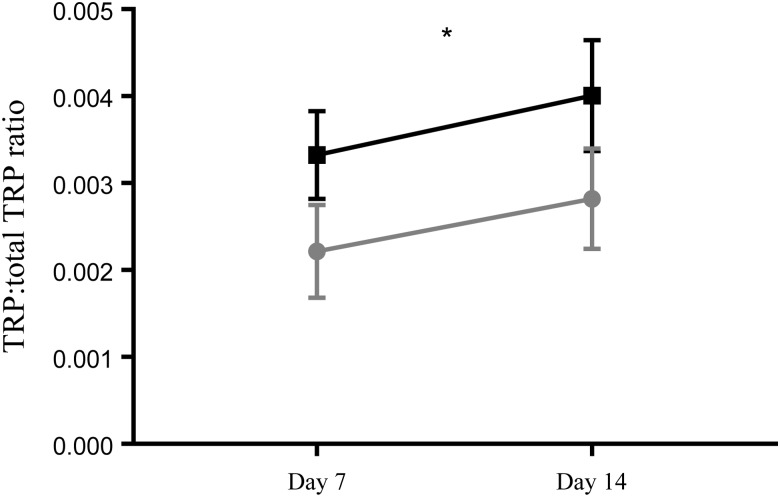
Fig. 6.
Free tryptophan (TRP):total TRP ratio in term (-■-) and preterm (- -) expressed breast milk (EBM) on day 7 and day 14. Results are means, with standard errors represented by vertical bars. See Supplementary Table S1 for the number of data points used. There was an overall significant difference between the term and preterm group (P < 0·05). The free TRP:total TRP ratio was significantly lower in the preterm EBM (P < 0·05) compared with term EBM. * P < 0·05 (two-way ANOVA).

